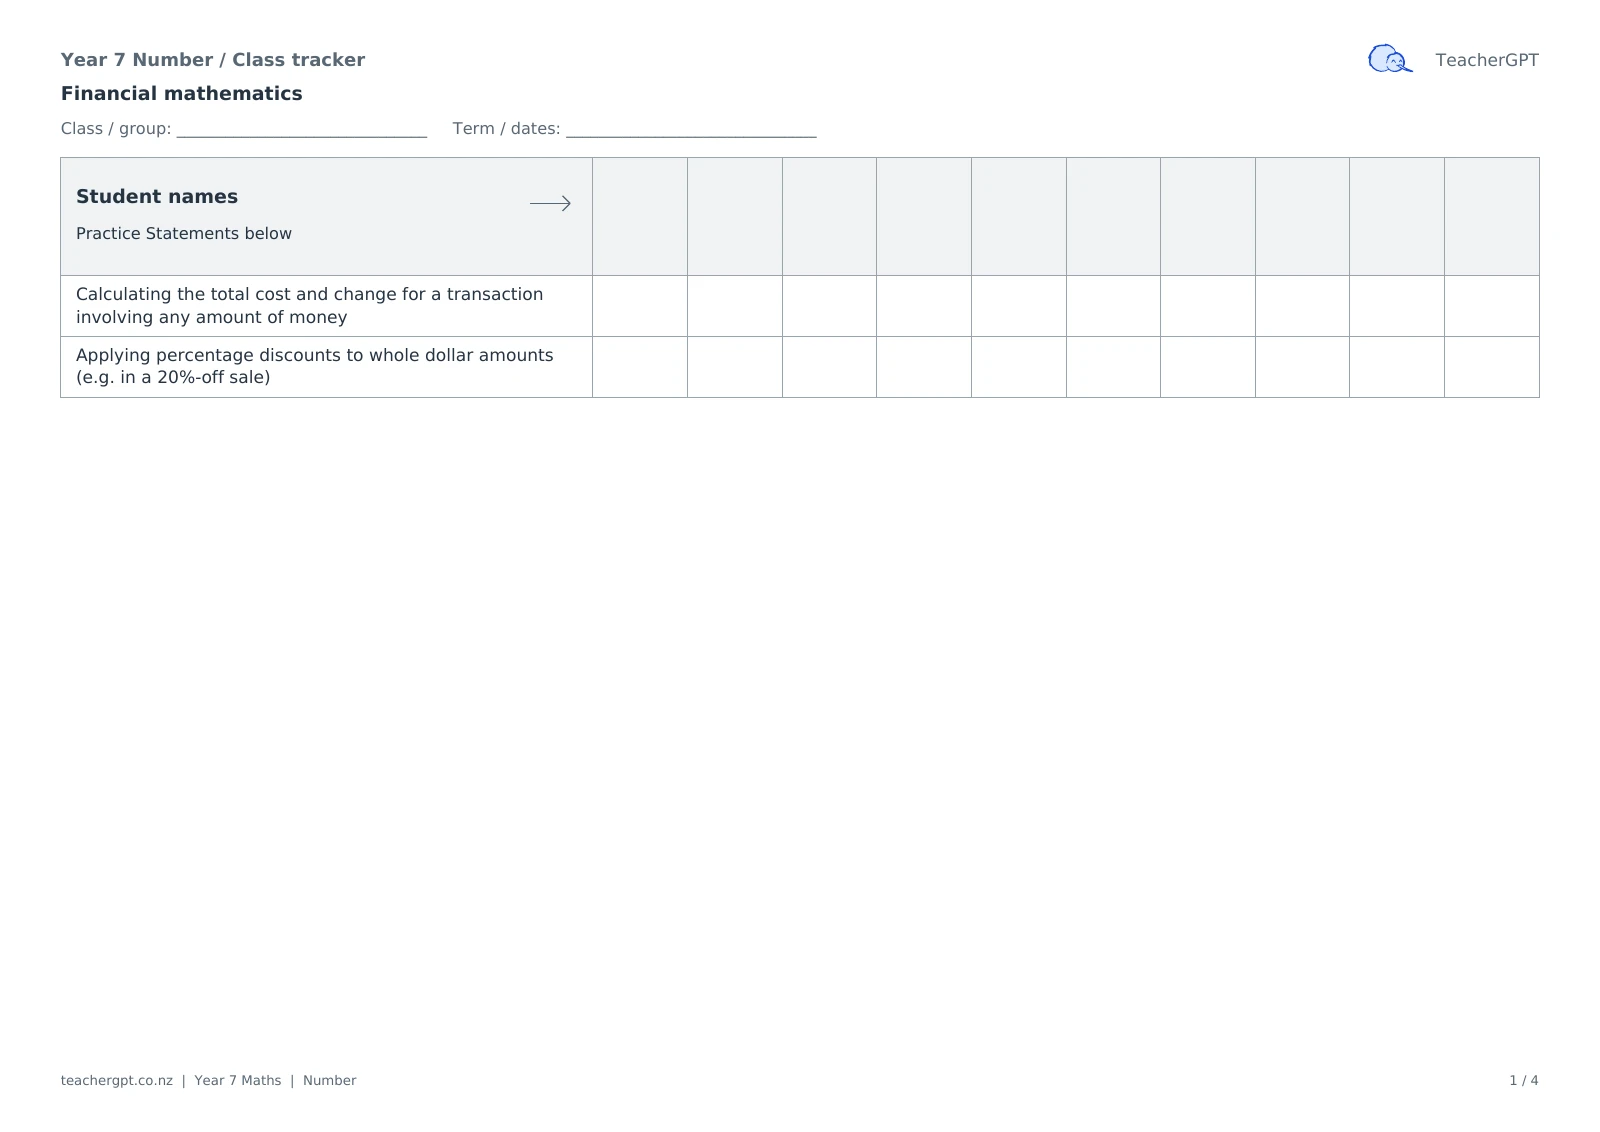
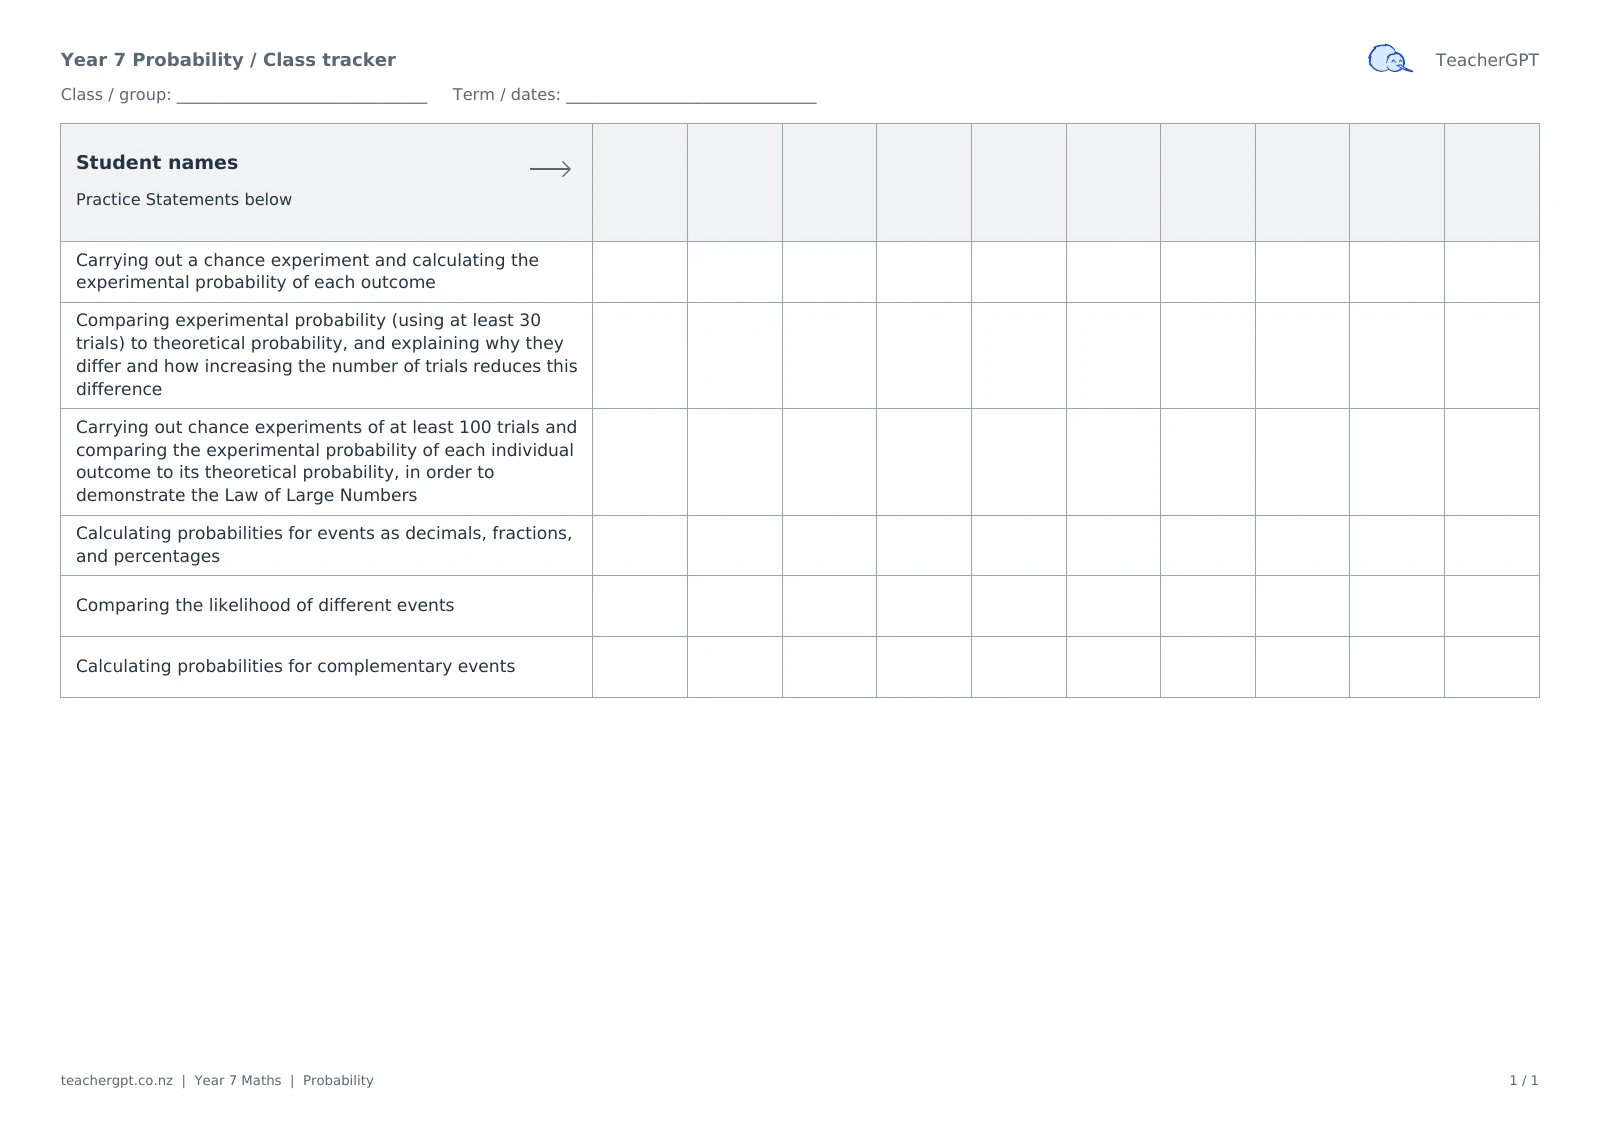
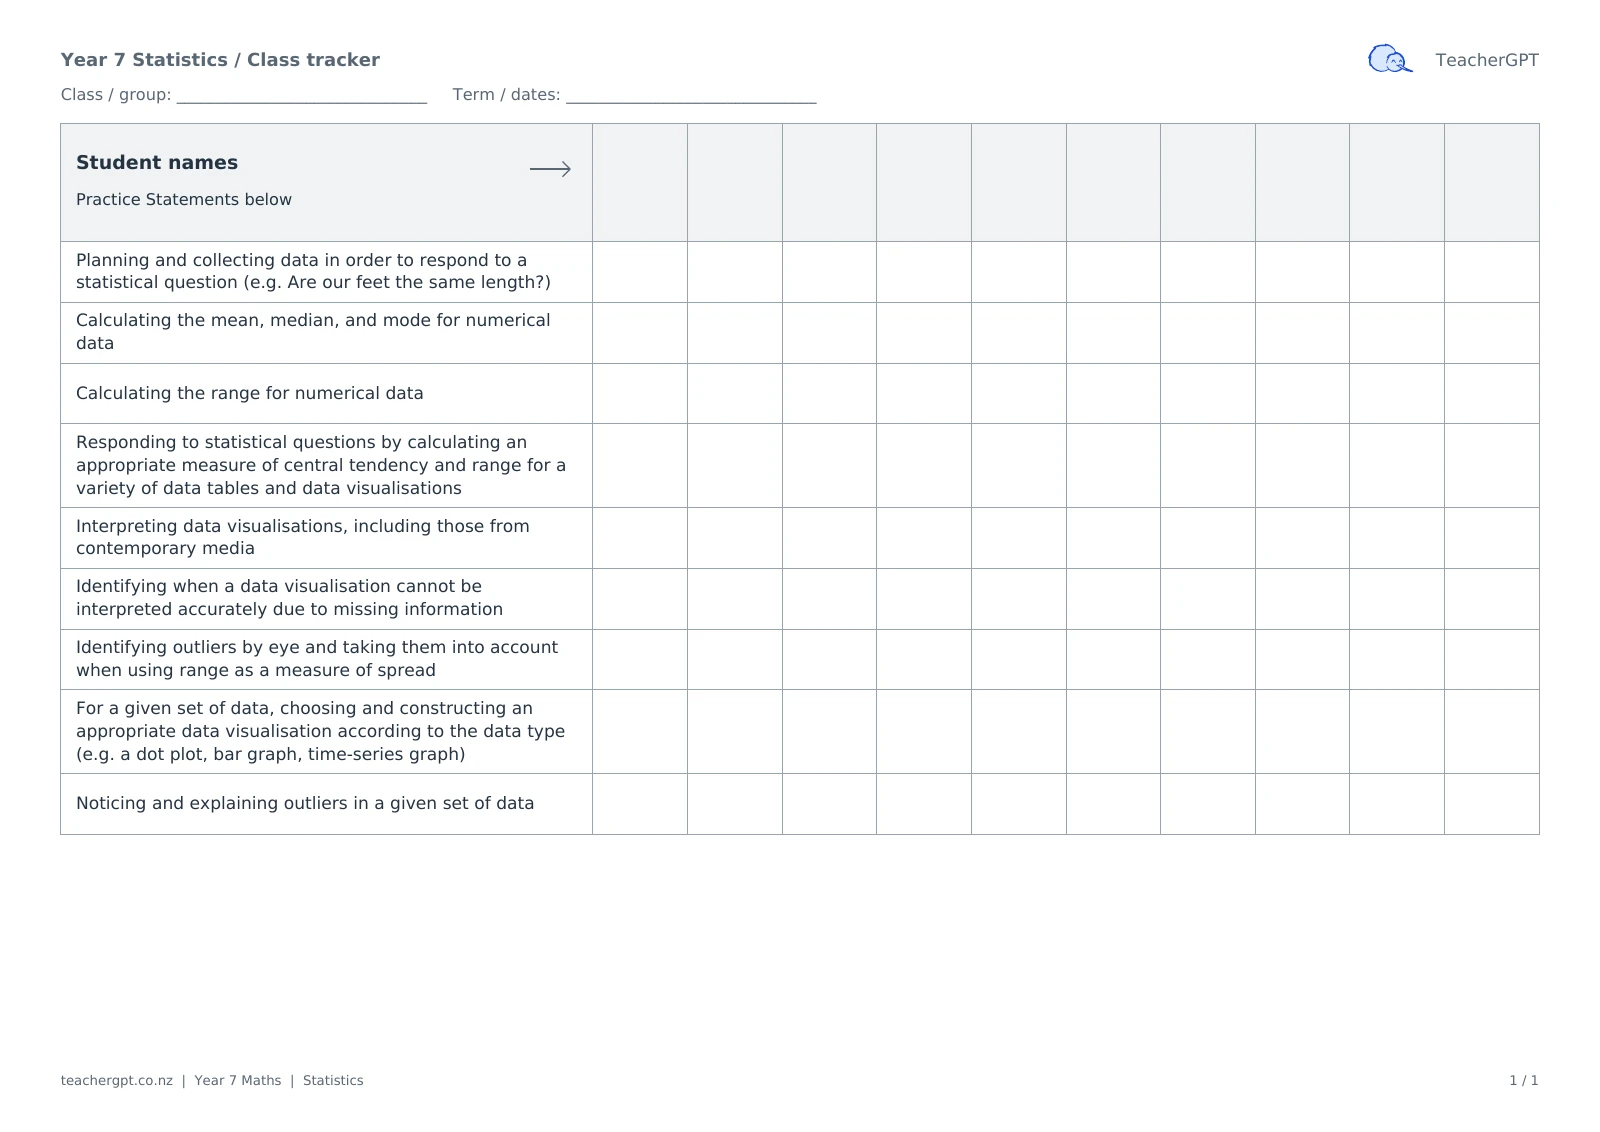
A simple tracker for your class. Practice Statements down the left, ten student-name spaces across the top, and blank cells to use your way.
Choose a strand below. Write in the names, then add your own ticks, dates, codes or notes. For a class of 25, print three copies of the tracker.
77 Practice Statements · 7 strands · PDF and Google Sheets · No TeacherGPT signup needed
Choose a tracker by strand
Each preview shows the first page of that PDF. Longer strands continue over several pages, with space for the same ten names on every page.
Prefer to work online? Choose Copy to Google Sheets to make your own editable copy in your Google account. The original is view-only. Add student names and notes to your own copy, and add more student columns if needed.
In the Number PDF, each curriculum subcategory starts on a new page. Longer subcategories continue under the same heading.
Algebra
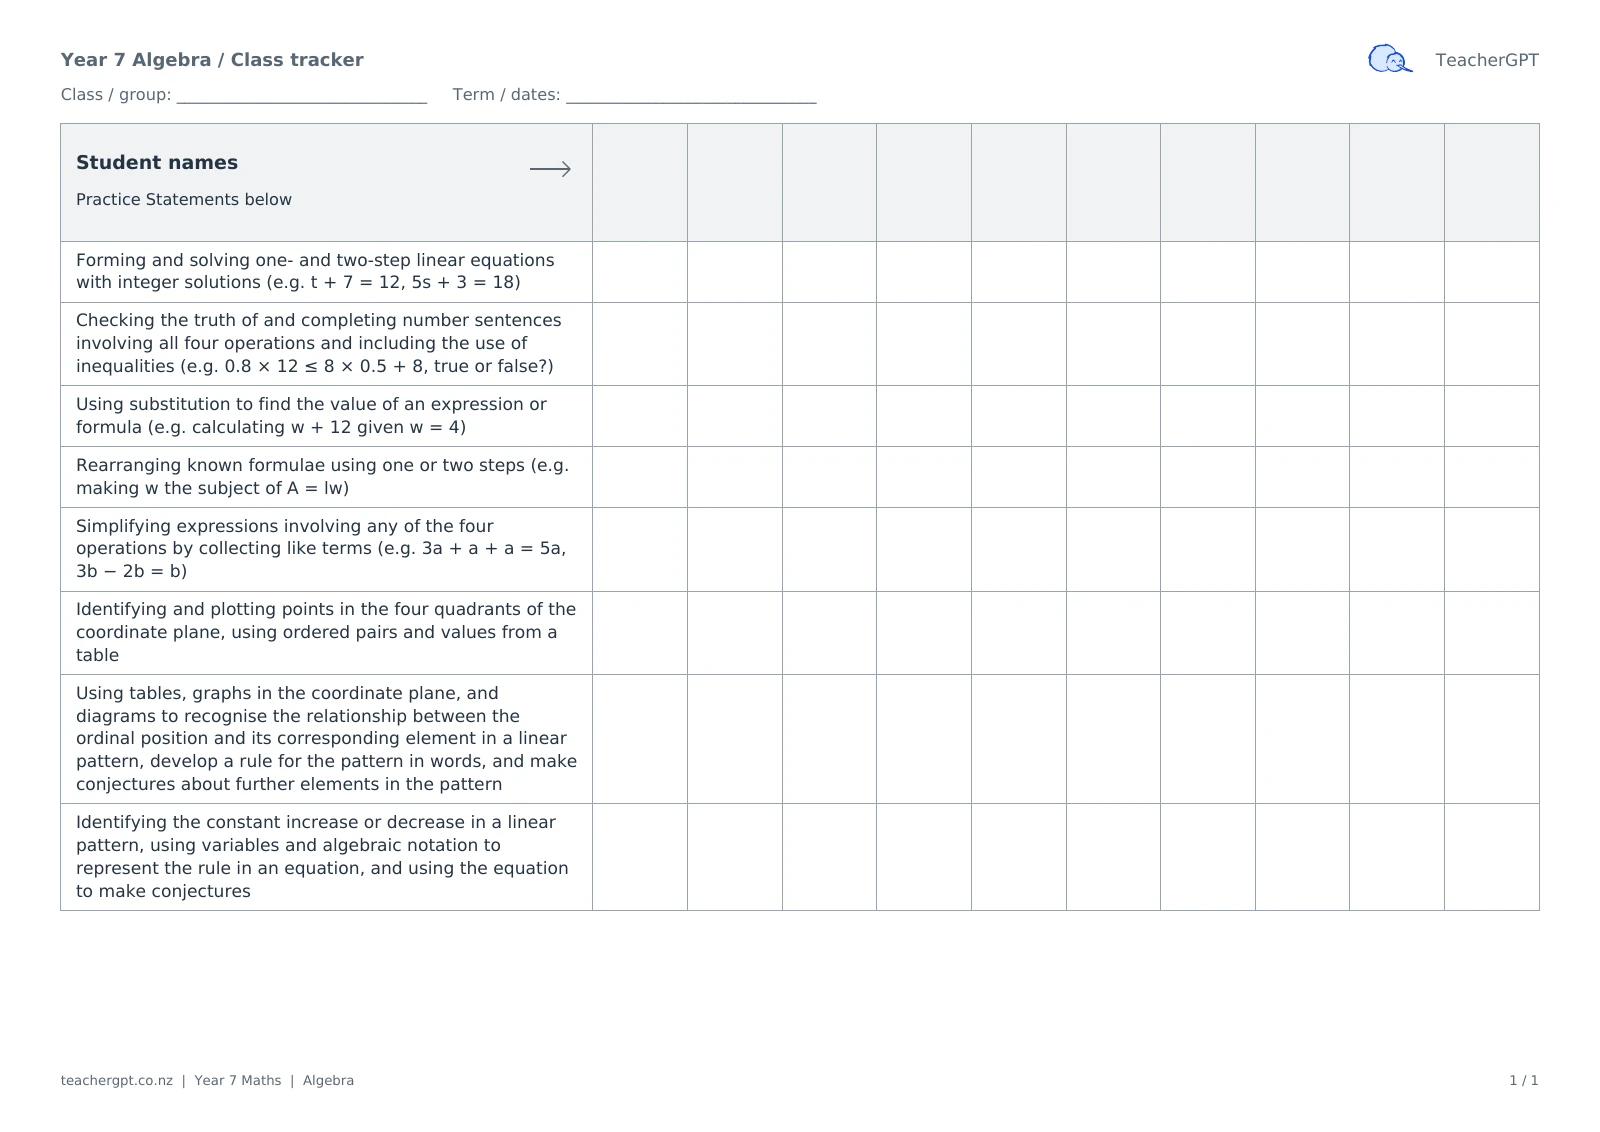
8 Practice Statements · 1 page · 10 student columns
These trackers cover all 77 stored Year 7 Maths Practice Statements, organised into their curriculum strands and skill groups.
Algebra
Equations and relationships
Forming and solving one- and two-step linear equations with integer solutions (e.g. t + 7 = 12, 5s + 3 = 18)
Checking the truth of and completing number sentences involving all four operations and including the use of inequalities (e.g. 0.8 × 12 ≤ 8 × 0.5 + 8, true or false?)
Using substitution to find the value of an expression or formula (e.g. calculating w + 12 given w = 4)
Rearranging known formulae using one or two steps (e.g. making w the subject of A = lw)
Simplifying expressions involving any of the four operations by collecting like terms (e.g. 3a + a + a = 5a, 3b − 2b = b)
Identifying and plotting points in the four quadrants of the coordinate plane, using ordered pairs and values from a table
Using tables, graphs in the coordinate plane, and diagrams to recognise the relationship between the ordinal position and its corresponding element in a linear pattern, develop a rule for the pattern in words, and make conjectures about further elements in the pattern
Identifying the constant increase or decrease in a linear pattern, using variables and algebraic notation to represent the rule in an equation, and using the equation to make conjectures
Geometry
Pathways
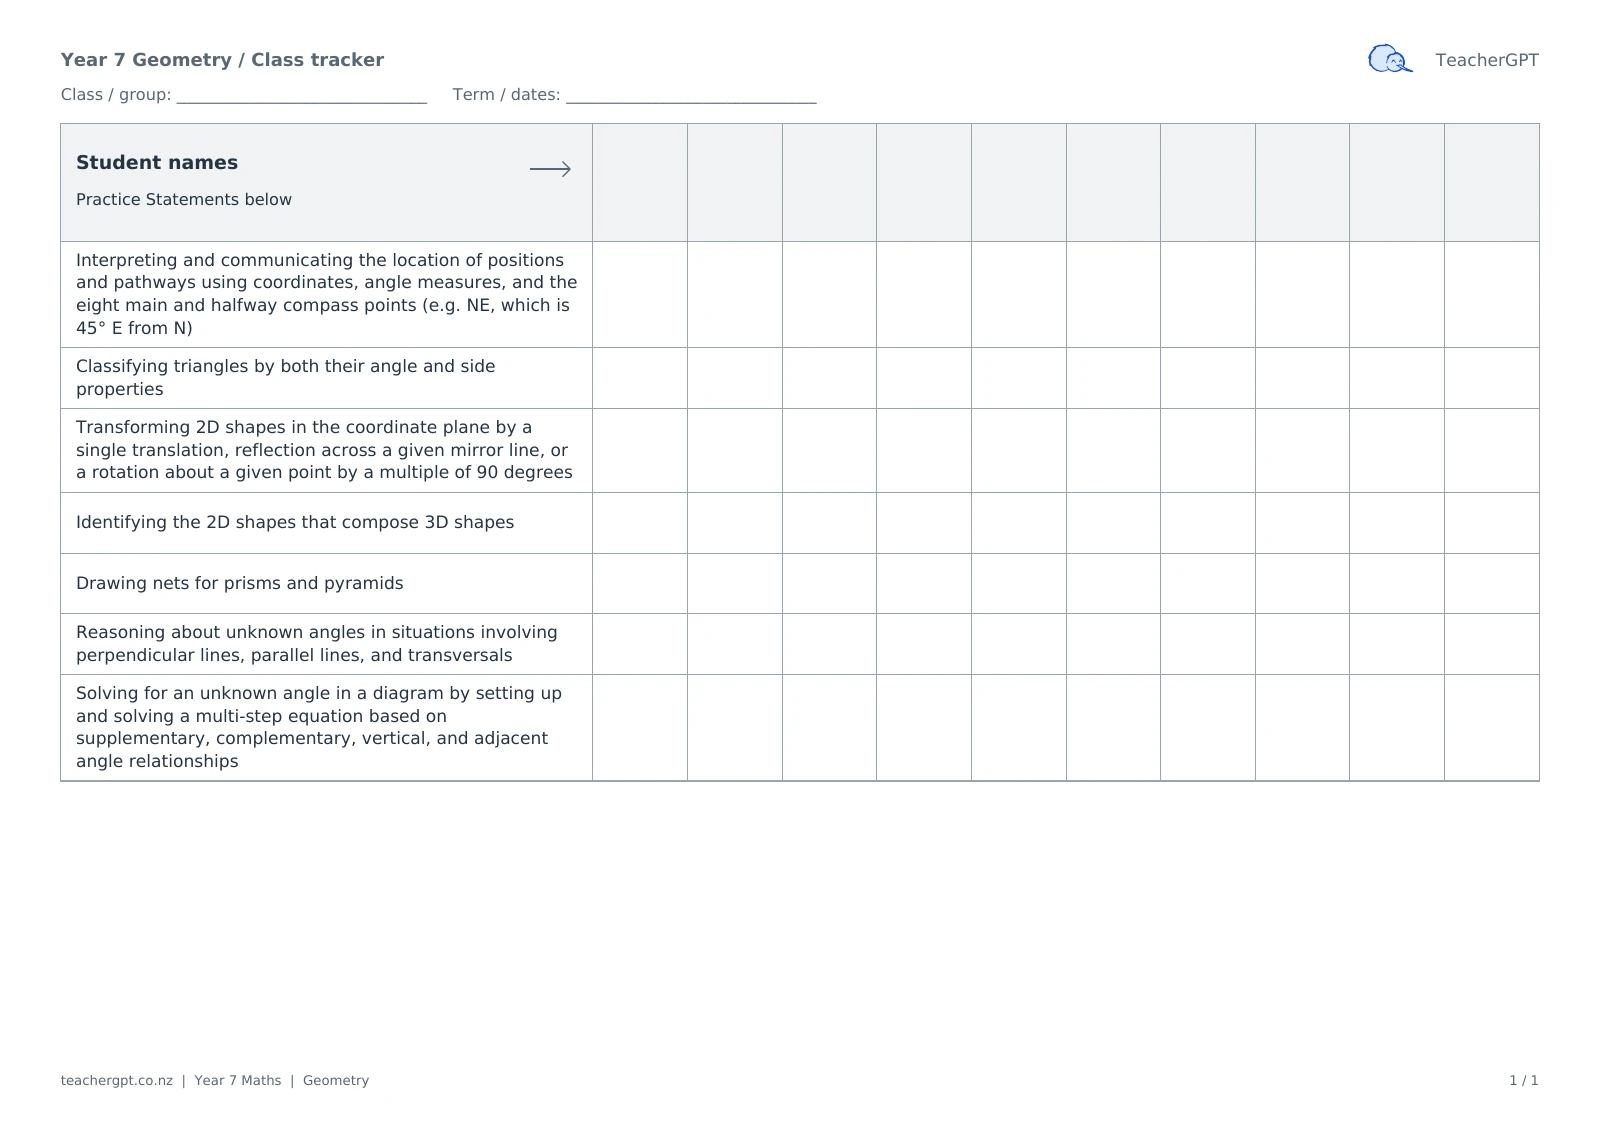
Interpreting and communicating the location of positions and pathways using coordinates, angle measures, and the eight main and halfway compass points (e.g. NE, which is 45° E from N)
Shapes
Classifying triangles by both their angle and side properties
Spatial reasoning
Transforming 2D shapes in the coordinate plane by a single translation, reflection across a given mirror line, or a rotation about a given point by a multiple of 90 degrees
Identifying the 2D shapes that compose 3D shapes
Drawing nets for prisms and pyramids
Reasoning about unknown angles in situations involving perpendicular lines, parallel lines, and transversals
Solving for an unknown angle in a diagram by setting up and solving a multi-step equation based on supplementary, complementary, vertical, and adjacent angle relationships
The language of Mathematics and Statistics
Algebra
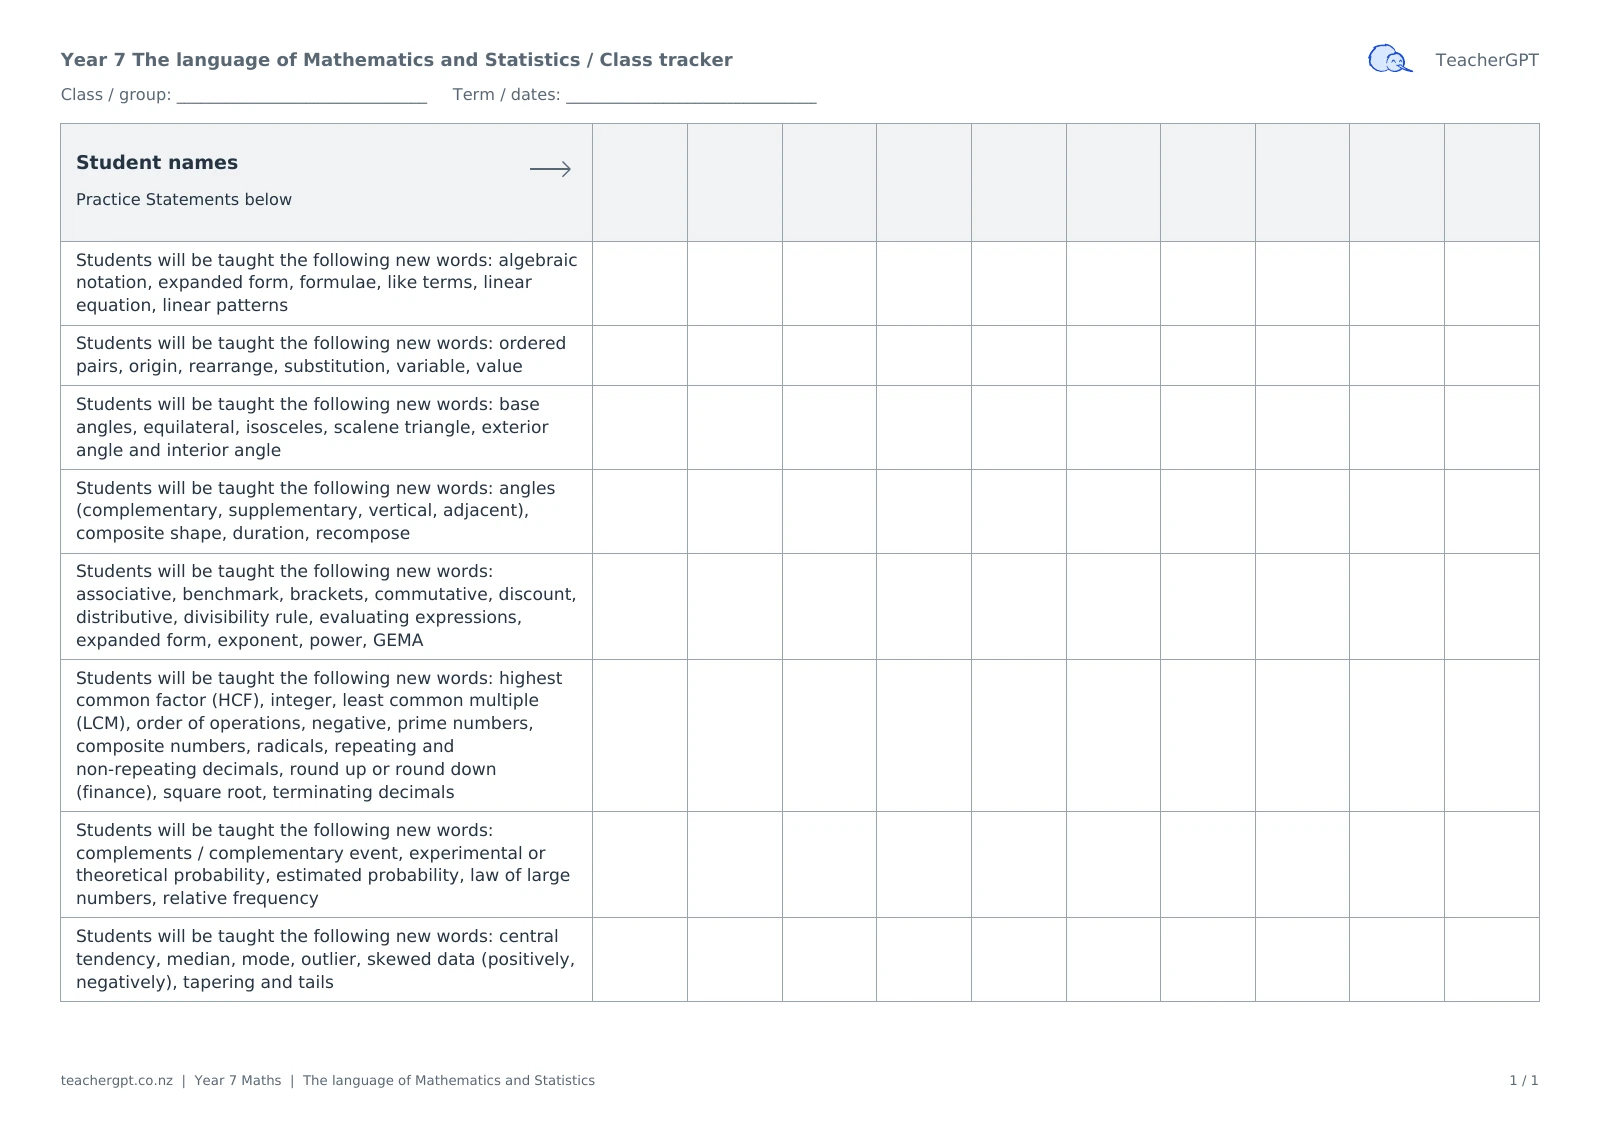
Students will be taught the following new words: algebraic notation, expanded form, formulae, like terms, linear equation, linear patterns
Students will be taught the following new words: ordered pairs, origin, rearrange, substitution, variable, value
Geometry
Students will be taught the following new words: base angles, equilateral, isosceles, scalene triangle, exterior angle and interior angle
Measurement
Students will be taught the following new words: angles (complementary, supplementary, vertical, adjacent), composite shape, duration, recompose
Number
Students will be taught the following new words: associative, benchmark, brackets, commutative, discount, distributive, divisibility rule, evaluating expressions, expanded form, exponent, power, GEMA
Students will be taught the following new words: highest common factor (HCF), integer, least common multiple (LCM), order of operations, negative, prime numbers, composite numbers, radicals, repeating and non-repeating decimals, round up or round down (finance), square root, terminating decimals
Probability
Students will be taught the following new words: complements / complementary event, experimental or theoretical probability, estimated probability, law of large numbers, relative frequency
Statistics
Students will be taught the following new words: central tendency, median, mode, outlier, skewed data (positively, negatively), tapering and tails
Measurement
Measuring
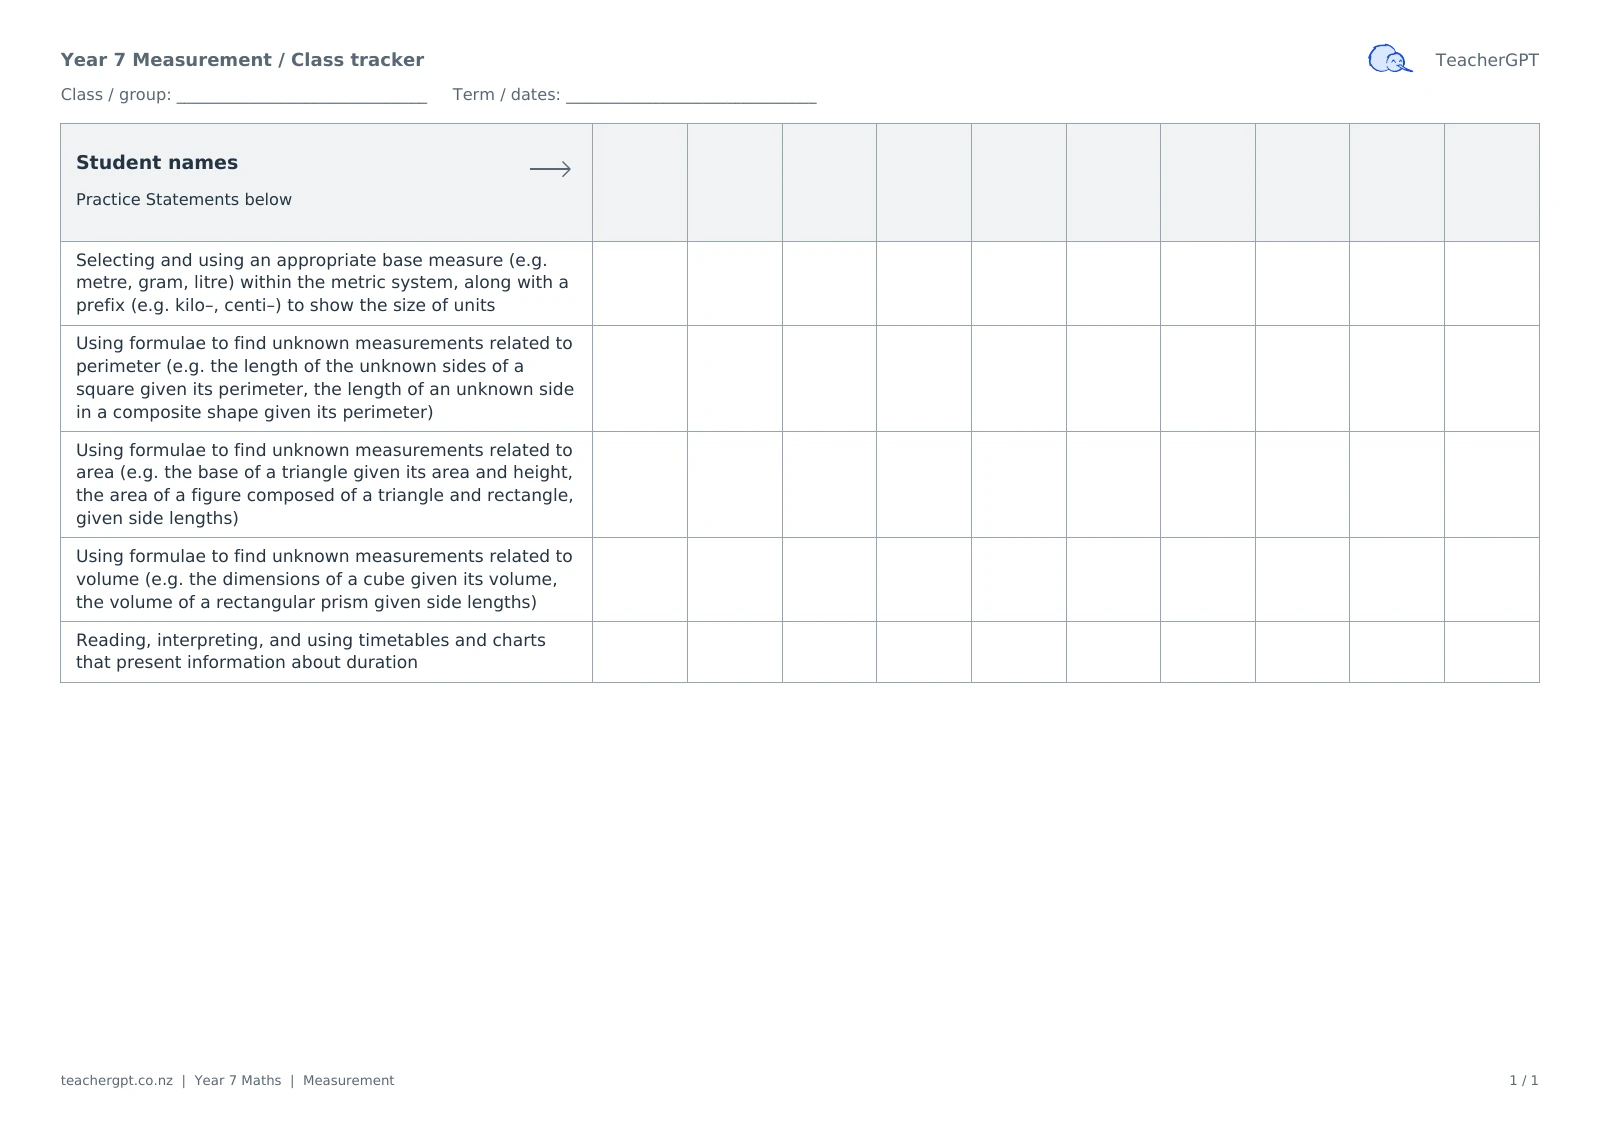
Selecting and using an appropriate base measure (e.g. metre, gram, litre) within the metric system, along with a prefix (e.g. kilo–, centi–) to show the size of units
Using formulae to find unknown measurements related to perimeter (e.g. the length of the unknown sides of a square given its perimeter, the length of an unknown side in a composite shape given its perimeter)
Using formulae to find unknown measurements related to area (e.g. the base of a triangle given its area and height, the area of a figure composed of a triangle and rectangle, given side lengths)
Using formulae to find unknown measurements related to volume (e.g. the dimensions of a cube given its volume, the volume of a rectangular prism given side lengths)
Reading, interpreting, and using timetables and charts that present information about duration
Number
Financial mathematics
Calculating the total cost and change for a transaction involving any amount of money
Applying percentage discounts to whole dollar amounts (e.g. in a 20%-off sale)
Number structures and operations
Reading, writing comparing, and ordering whole numbers using powers of 10 (e.g. 10,000 = 10^4, 1000 < 10^4)
Representing numbers in expanded form using powers of 10 (e.g. 34,506 = 3 × 10^4 + 4 × 10^3 + 5 × 10^2 + 6)
Using exponents and identifying square roots for square numbers up to at least 144
Using radicals (√) to represent square roots
Using divisibility rules to identify numbers that are divisible by 2, 3, 4, 5, 6, 8, 9, and 10
Identifying prime numbers to 100
Finding the highest common factor (HCF) of two numbers under 100, and finding the least common multiple (LCM) of two numbers under 10
Locating integers on a number line
Ordering whole negative and positive numbers using a number line
Identifying the additive inverse of any number
Representing addition and subtraction of integers using a number line
Using negative numbers to solve problems in a range of contexts, including the measurement of temperature and finance
Using rounding and estimation to predict results and to check the reasonableness of calculations (e.g. 0.73 + 0.8 + 0.999 must be less than 3 since each are close to but less than 1)
Rounding whole numbers to any specified power of 10, and rounding decimals to the nearest whole number, tenth, or hundredth
Multiplying whole numbers
Dividing whole numbers by one- or two-digit divisors (e.g. 327 ÷ 5 = 65.4 or 65 2/5)
Evaluating expressions using the order of operations
Identifying, reading, writing, and representing fractions, decimals, and percentages
Comparing, ordering, and converting between fractions, decimals, and percentages
Finding equivalent fractions and representing fractions in their simplest form
Adding and subtracting fractions, including improper fractions and mixed numbers, and representing the answer in its simplest form
Adding and subtracting decimals
Multiplying and dividing numbers by powers of 10
Multiplying whole numbers by fractions and representing the answer in its simplest form
Multiplying decimals by whole numbers (e.g. 0.7 × 5 and 0.7 × 50, which both relate to knowing 7 × 5 = 35)
Dividing fractions by whole numbers and representing the answer in its simplest form
Dividing a whole number by a unit fraction
Finding a fraction of a whole number (e.g. 5/3 of 186)
Finding a whole amount when given a fraction (e.g. 5/4 of the set is 85, what is the whole set?)
Finding common percentages of whole numbers
Finding the whole (100%) when given a percentage (e.g. 40% is 28)
Using proportional reasoning to explore multiplicative relationships between quantities (e.g. "If there are 3 red for every 7 blue balls, how many balls are there altogether when there are 18 red balls?")
Probability
Experimental probability
Carrying out a chance experiment and calculating the experimental probability of each outcome
Comparing experimental probability (using at least 30 trials) to theoretical probability, and explaining why they differ and how increasing the number of trials reduces this difference
Carrying out chance experiments of at least 100 trials and comparing the experimental probability of each individual outcome to its theoretical probability, in order to demonstrate the Law of Large Numbers
Theoretical probability
Calculating probabilities for events as decimals, fractions, and percentages
Comparing the likelihood of different events
Calculating probabilities for complementary events
Statistics
Developing knowledge from data
Planning and collecting data in order to respond to a statistical question (e.g. Are our feet the same length?)
Calculating the mean, median, and mode for numerical data
Calculating the range for numerical data
Interpretation of data
Responding to statistical questions by calculating an appropriate measure of central tendency and range for a variety of data tables and data visualisations
Interpreting data visualisations, including those from contemporary media
Identifying when a data visualisation cannot be interpreted accurately due to missing information
Identifying outliers by eye and taking them into account when using range as a measure of spread
Visualisation of data
For a given set of data, choosing and constructing an appropriate data visualisation according to the data type (e.g. a dot plot, bar graph, time-series graph)
Noticing and explaining outliers in a given set of data